
5-BPaaS Evaluation
5-BPaaS Evaluation
Collecting cross-layer information on the behaviour of applications in the cloud and the corresponding interpretation is a key challenge in in digital transformation. The aim is not to only collect data, but also provide the corresponding context to support human- and / or machine interpretation of that data. We see therefore the dashboard not only as a collection, abstraction and visualisation of data, but as a decision support tool that either supports decision makers, or in well-defined cases also enable automated machine-based interventions.
We propose to use concept models for the realisation, as conceptual models can support the full range of knowledge representation starting from semi-formal models that support human interpretation, till strict-formal models that enable calculations. Informal models represent knowledge using graphical models in combination with textual descriptions, whereas strict-formal model, partly use the graphical representation but focus more on the formal semantic via ontologies as well as corresponding inference rules definition. Hence both, human estimations and manual entries, aggregations of sensor data and semantic SPARQL queries in triple stores can be supported in the BPaaS Evaluation Environment.
The BPaaS Evaluation Environment is the counterpart of the BPaaS design and allocation environment by abstracting monitoring information from the execution of the BPaaS back onto the business layer. Semantic mechanisms are used to abstract sensor information that is harvested from different layers back to business relevant Key Performance Indictors.
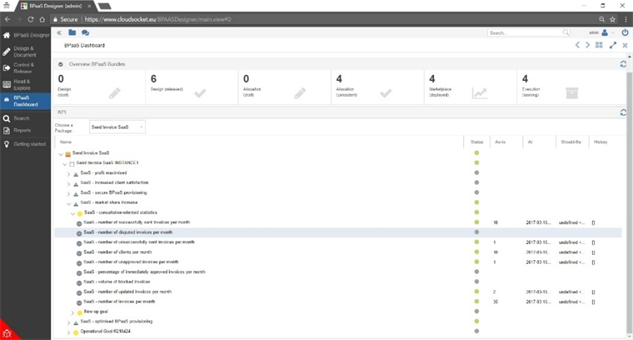

The Figure shows the dashboard with cross-layer Key Performance Indicators (KPIs) of Business Processes as a Service (BPaaS) aggregating technical, organizational and business aspects to a set of decisions relevant KPIs
The following innovation item has been injected in the generic dashboard.
- Information Harvesting
OWL-Q has been used and extended with KPI information to enable a semantic database with semantic enriched sensor data streams. The harvesting module uses information from the BPaaS concept model in order to semantically lift a particular sensor information and stores it into the semantic knowledge base. - KPI drill down
The (a) pattern matching module, and the (b) process mining module provide generic algorithms to other components in order to search within the OWL-Q knowledge base. The deployment discovery module, offers domain specific algorithms to assess the complete deployment of a BPaaS. The conceptual analytics component bridges between business KPIs and the OWL-Q knowledge base using SPARQL statements that are mapped to each KPI. More detail on the can be found.
All aforementioned BPaaS environments are available for demonstration and relevant parts can be downloaded for use and further improvement. The next section explains how the introduced solutions will evolve after the project lifetime.
Information
BPaaS Evaluation - Trainer GuidelineBPaaS Evaluation - Presentation Slides
Video BPaaS KPI Design
Video BPaaS Evaluation
Deliverable D3.5 BPaaS Monitoring and Evaluation Blueprints
Deliverable D3.6 BPaaS Monitoring and Evluation Prototype
Deliverable D4.5 Final Architecture
Deliverable D4.6 BPaaS Design and Evaluation Prototype
Innovation Item 4.1 Smart Business Intelligence Analysis Tool
Innovation Item 4.2 Hybrid Business Dashboard
Sample Dashboard (not BPaaS)
Use
ADOscoreExtend
ADOxx.org CloudSocket Development SpaceAdditional Information
Contact Person/Point: BOCRelated CloudSocket Environment: Evaluation